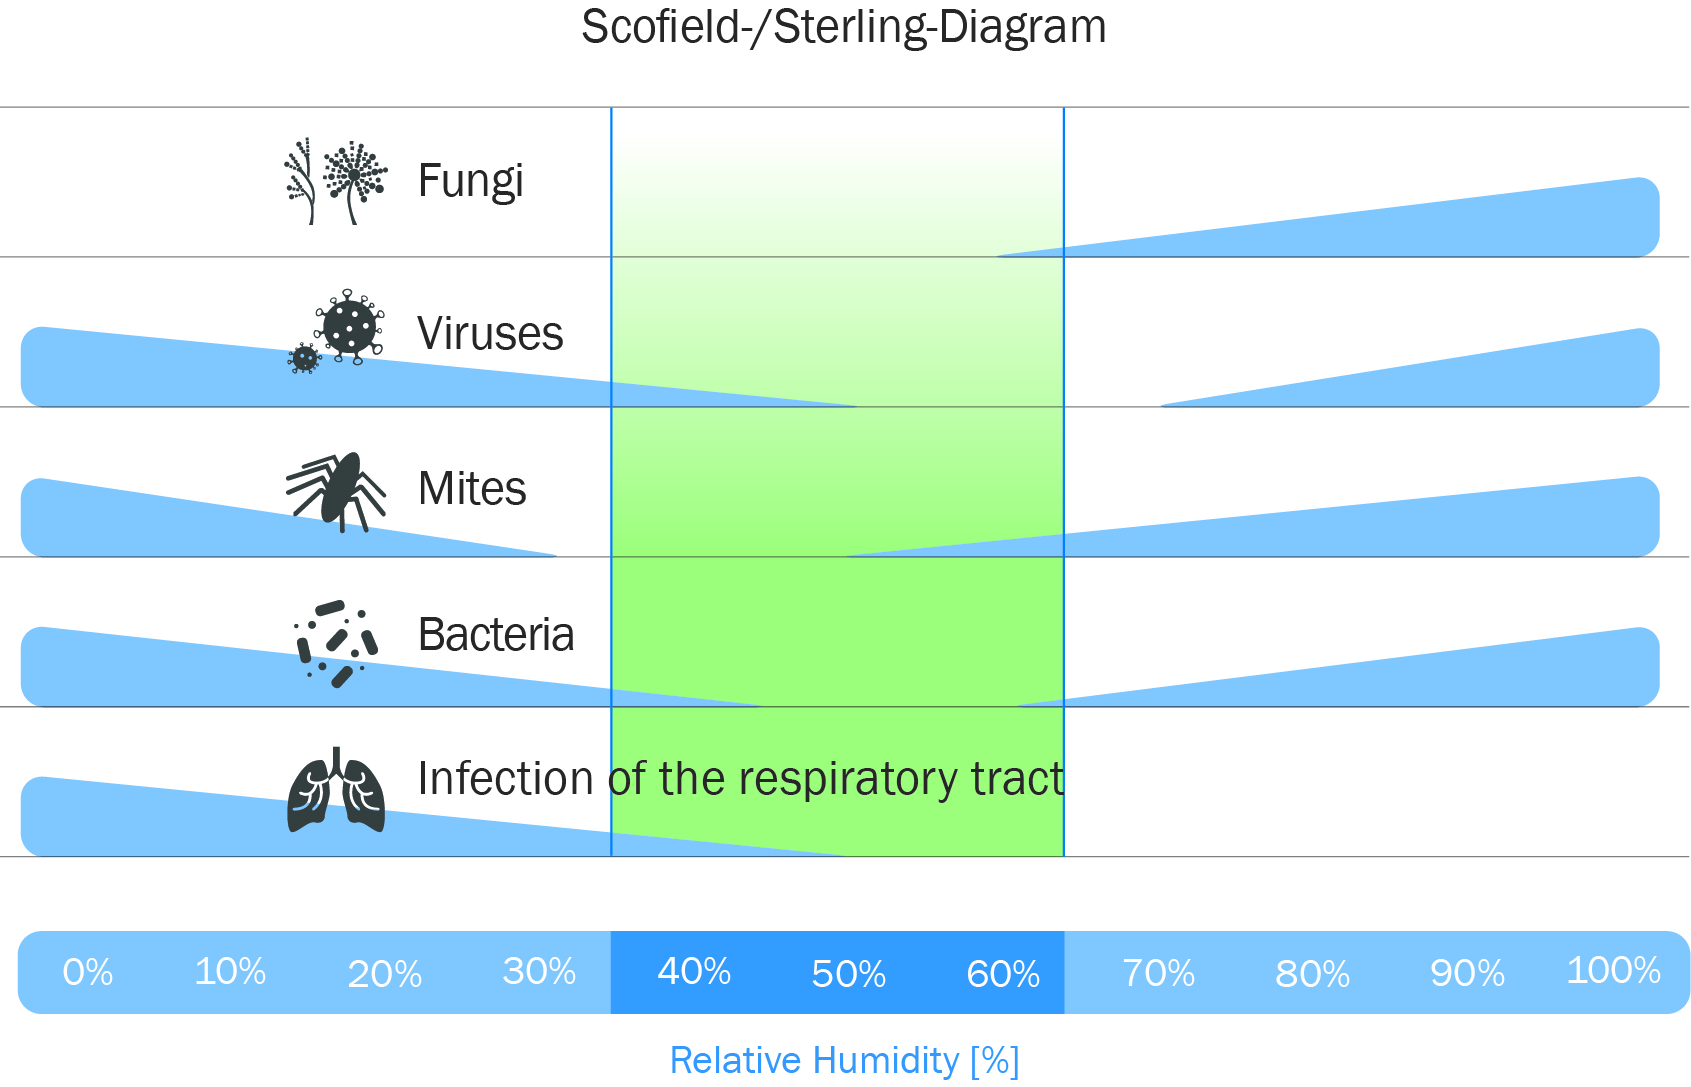


What is the Sterling Chart?
The Sterling Chart illustrates how relative humidity affects health and well being and shows that the optimal air humidity level for humans is between 40 to 60% RH. This optimal humidity zone minimizes risks to human health from biological contaminants and pathogens.
Colds, viruses, respiratory infections, dry eyes, itchy and cracked skin are all symptoms that are usually prevalent in the cold dry months of the winter when the indoor RH is at its lowest.